One closure. Three price stories. Crude itself rose about 62% — so none of the three simply "followed oil."
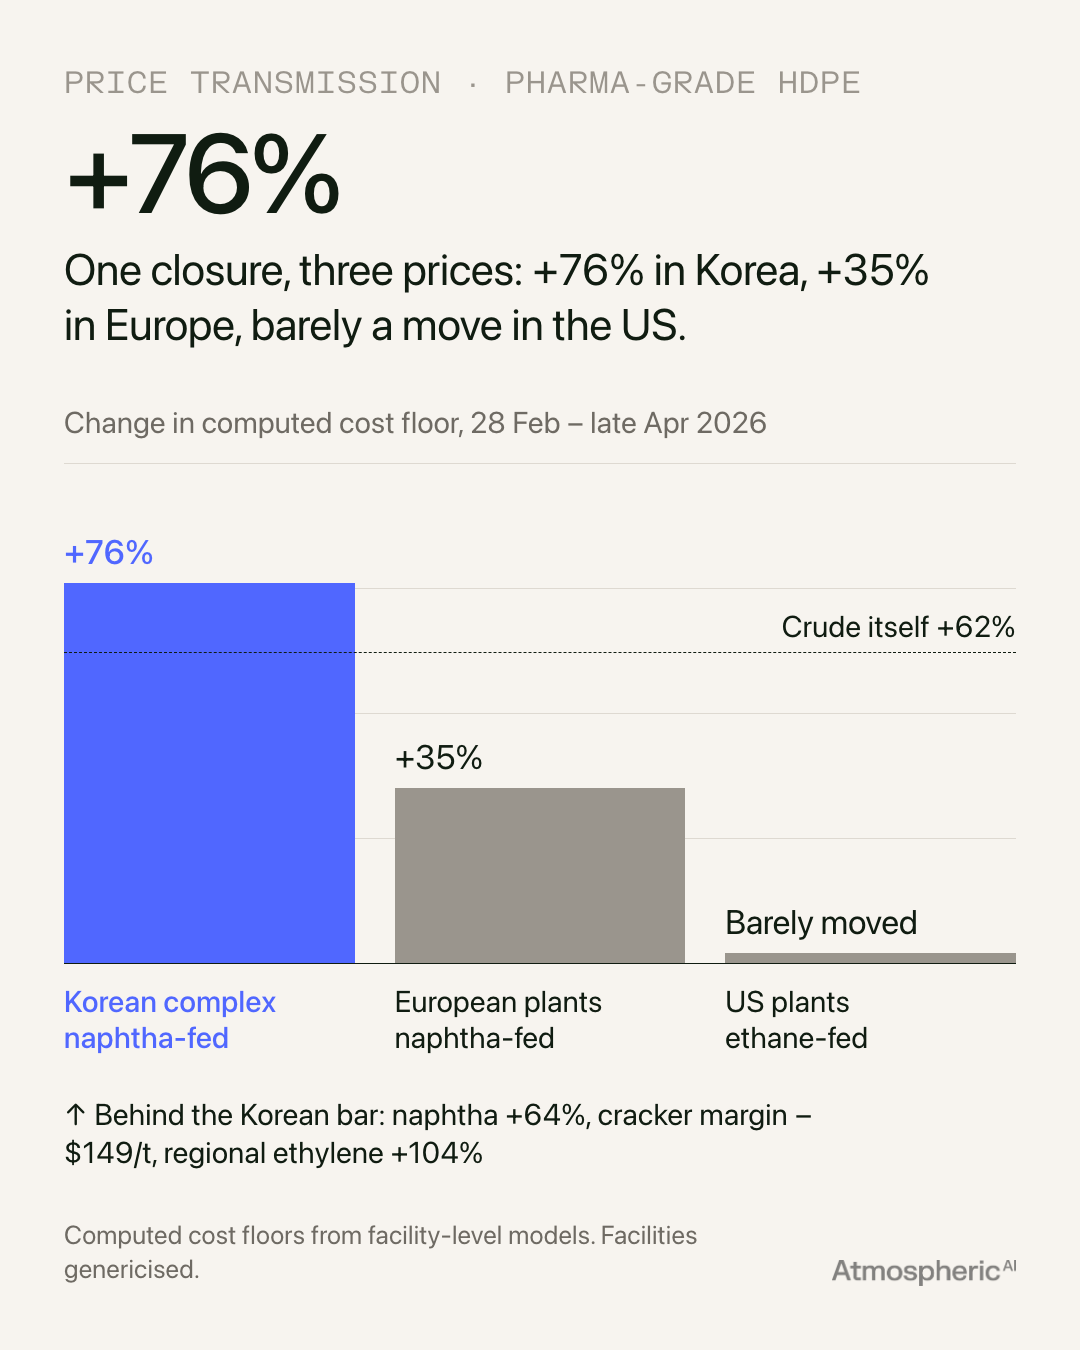
The Strait of Hormuz closed on 28 February. Within eight weeks, the computed cost of making pharmaceutical-grade HDPE at one Korean petrochemical complex had risen 76%. At European plants making the same polymer, the move was 35%. At US plants, it barely registered.
One closure. Three price stories. Crude itself rose about 62% — so none of the three simply "followed oil."
Where a polymer's feedstock comes from can be mapped — for one real grade, a fifth of its crude sailed through Hormuz. That's exposure. This is the harder question: what exposure does to price. The popular model — oil up X%, plastics up X% — treats price transmission as a property of the commodity. It isn't. It's a property of the supply chain, and it can be computed, step by step, by watching the physical system respond. We ran this analysis at the end of April — eight weeks into the closure, as the first cracker shutdowns in Asia were being reported — and the numbers below are that snapshot. Here are the steps, at one facility.
The facility is one of Asia's largest integrated petrochemical complexes, on South Korea's southern coast. Its supply chain is short: crude arrives by tanker, is refined into naphtha at the refinery next door, piped a few kilometres to a steam cracker, and piped again to the polymer plant. Before the closure, roughly two-thirds of the crude entering that refinery had transited Hormuz. Then the strait shut, and the transmission began.
Step one: the flows moved first. Within eight weeks, crude arriving in South Korea had fallen 44%. Naphtha imports fell 42% — and the Gulf's share of them collapsed from 52% to 13%. Notice that naphtha was hit harder than crude: the Gulf's condensate splitters, which supply much of Asia's imported naphtha, sit behind the strait too. None of this comes from press releases; it is visible in the movements of the ships themselves.
Step two: the workaround has a ceiling, and the ceiling is arithmetic. Saudi crude didn't stop flowing to Korea — it rerouted. Every barrel that used to load at Gulf terminals now crosses the peninsula by pipeline to the Red Sea. But pipeline capacity is finite and largely committed westward, capping Saudi deliveries to Korea at roughly 15 million tonnes a year against 53 before the crisis. The reroute is real. It closes about a quarter of the gap, and no amount of goodwill changes the pipe's diameter.
Step three: scarcity has a queue, and plastics stand at the back of it. When crude is short, Korean refiners direct it to diesel and jet fuel before naphtha — a matter of policy, not preference. Transport fuels are politically essential; petrochemical feedstock is not. So the shortage lands hardest one layer below where the headlines look.
Step four: the crackers do the rational thing, and make everything worse. Naphtha rose 64%, from $607 to $994 a tonne. A steam cracker's economics work like this: 2.8 tonnes of naphtha yield about 2.4 tonnes of sellable chemicals — ethylene, propylene, butadiene feedstock, aromatics. At the new naphtha price, the whole basket no longer covered the feedstock bill: the industry's standard cracker margin swung from a normal +$200–400 per tonne to roughly −$149. Faced with a sustained cash loss, operators across the region began taking cracker capacity offline — not because feedstock had physically run out, but because running it destroyed money. Rational for each operator; brutal for the region, because every idled cracker removed ethylene supply at the worst possible moment. Regional ethylene prices spiked 104% — so violently that ethylene began trading above polyethylene. Pause on that: the raw material now cost more than the finished polymer, which means the benchmark index most polymer contracts are priced against had stopped describing reality — at precisely the moment both sides of every negotiation needed it most.
Step five: the number arrives at the polymer gate. Feed all of this through the facility's cost structure — feedstock, co-product revenues, utilities, fixed costs, freight — and the computed floor for pharma-grade HDPE from this complex moved from roughly $990 to roughly $1,744 per tonne. Up 76%, in eight weeks, from a strait 6,500 kilometres away.
Now run the identical computation on the same polymer elsewhere. European naphtha-fed plants: +35–36% — exposed to the same crude repricing, but nowhere near the same feedstock scarcity, refinery queue, or regional cracker shutdowns. US ethane-fed plants: nearly unmoved, because their feedstock never saw the strait at all. Same product, same crisis, three entirely different prices — and every difference was knowable in advance from each facility's feedstock map. Exposure is where transmission starts; the structure of the chain decides where it ends.
The honest caveats: the flow figures compare an eight-week pre-closure window with the first weeks after in-transit cargoes cleared, and later data will have settled them; and the cost figures are computed floors from our facility models, carrying the uncertainty any bottom-up model carries. The direction and the spread are the finding; the decimals are not.
So "what does Hormuz do to the price of plastic?" turns out to have no single answer — only computed ones, facility by facility. Which raises the question every buyer is now sitting with: when a supplier passes through an increase, how much of it is this mechanism, and how much is the market's fog? When is a surcharge genuine, when is it opportunism — and how do crisis prices quietly become next year's baseline? That's a different computation. Next time.
— Toby
One question the world is asking, and the computed answer. Bi-weekly. Nothing else.
Subscribe



